This means communicating data findings clearly so businesses can make informed decisions.
Data Visualization & AI Using Python Course
Master the future of data-driven decision making with the Data Visualization & AI Using Python Course at Inspiro Edutech.
This intensive, industry-focused program empowers learners to transform raw data into powerful insights using Python, Tableau, and essential AI concepts, preparing them for high-impact roles in Data Analytics, Business Intelligence, and AI-driven reporting.
What is Data Visualization & AI Using Python?
Data Visualization & AI using Python focuses on analyzing, interpreting, and visually presenting data using Python libraries and business intelligence tools, combined with AI concepts such as trends, correlation, and forecasting to support intelligent decision-making.
The Data Visualization & AI Using Python Course at Inspiro Edutech blends programming, statistics, visualization, and AI concepts to create a complete, industry-ready analytics skillset.
Why Learn Data Visualization & AI?
Organizations today rely heavily on data storytelling and visual intelligence to drive business decisions.
High demand across industries
Suitable for technical & non-technical backgrounds
Strong global career opportunities
Critical skill for analytics & AI roles
Used in finance, IT, healthcare, marketing & enterprise reporting
Hands-On Projects & Practical Training
✔Data analysis projects using real datasets
✔ Visualization & dashboard creation
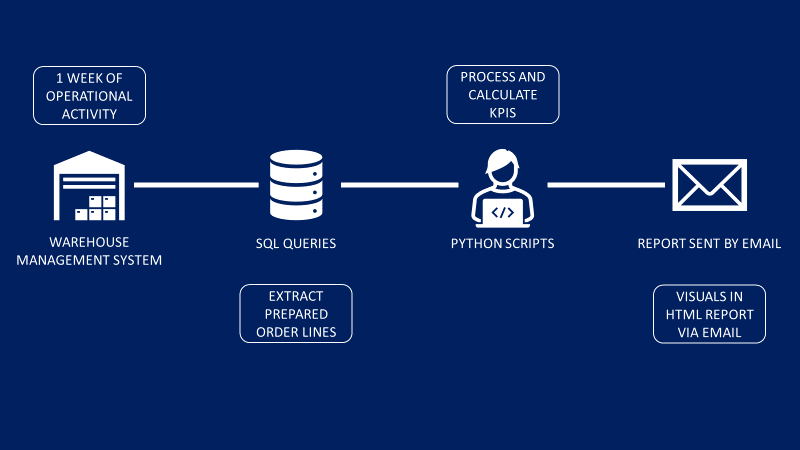
✔ Business reporting case studies
✔ Industry-oriented capstone project
Course Details
- Duration: 6 Months
- Mode: Offline/Online (Instructor-led)
- Prerequisites: Basic programming knowledge
- Certification:: Inspiro Edutech
Approved By


Register Now
Career Opportunities
After completing this course, learners can pursue roles such as:
- Data Analyst
- Business Intelligence Analyst
- Data Visualization Specialist
- Reporting Analyst
- AI-Driven Analytics Professional
What You Will Learn
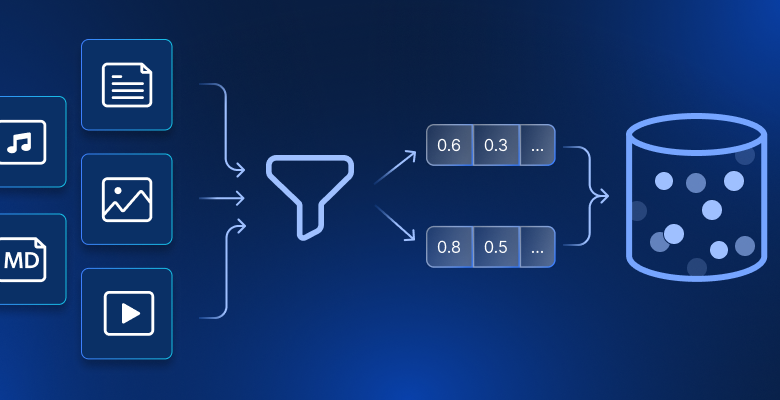
Analyze and clean raw datasets using Python involves inspecting data to find errors, missing values, and inconsistencies, then fixing them using Python libraries like Pandas and NumPy.
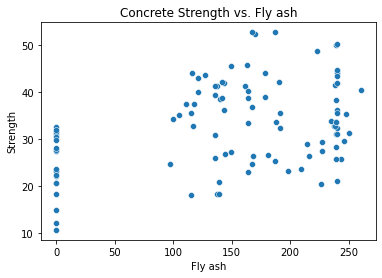
EDA means exploring and summarizing data using visuals and statistics to understand patterns, trends, and relationships.
This involves using statistical methods to analyze data and draw meaningful conclusions from it.
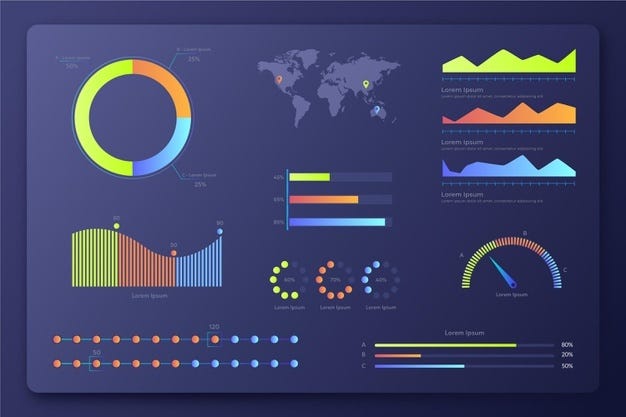
It means designing clear visualizations that help users easily understand data insights.
This refers to creating dynamic and user-friendly reports in Tableau that allow users to explore data visually.
It involves applying AI and machine learning techniques to predict future trends based on past data.
Why Learn at Inspiro Edutech?
Program Highlights
✔ Industry-focused curriculum
✔ Practical, project-based learning
✔ Expert trainers with real-world experience
✔ Certification support
✔ Placement assistance & interview guidance
✔ Globally relevant skills
✓ Learn Python for Data Science
✓ Data Analysis & Data Wrangling
✓ Exploratory Data Analysis (EDA)
✓ Statistics for Data Analytics
✓ Data Visualization using Python
✓ Data Visualization using Tableau (BI Tool)
✓ Charts, Dashboards & Data Storytelling
✓ Capstone Projects with Real-World Data
✓ Certifications & Placement Assistance
Why Inspiro Edutech Stands Out in Trivandrum, Kerala
Strategic Location
Based in Trivandrum, close to Technopark, allowing access to a vibrant IT environment.
Industry Interface
Tie up with leading tech companies for practical training and placement.
Low Fee Structure
Get quality training at a reasonable
price.
price.
High-End Lab
Hands-on learning experience using the latest development tools and software
Real-Time Exposure
Working on live projects will enhance your resume and improve employability.
Who Can Join This Course?
Students & fresh graduates
Job seekers targeting full stack roles
Working professionals upgrading skills
Career switchers entering IT development
Tools & Technologies Covered
Tools


Business Analytics & AI Concepts

Are you looking for Related Course?
Are you looking for


Training Locations Served
Training Locations
Online training available for learners from all regions.
FAQ
Frequently Asked Questions (FAQs)
Yes. The course starts with Python basics and gradually advances to data visualization and AI concepts.
You will learn Matplotlib, Seaborn, Plotly, and Power BI concepts using Python.
Yes. The course covers AI fundamentals, machine learning basics, and data-driven intelligence techniques.
Yes. Data visualization and AI skills are in demand across industries worldwide.
Yes. Instructor-led online training is available for learners from anywhere.
Join Inspiro Edutech
Start your journey to becoming a Data Visualization & AI Using Python professional with Inspiro Edutech. Whether you are a student, fresher, or working professional, this course will empower you with the skills required to thrive in the ever-growing IT industry.